How Perceptions Differ from Reality Regarding Population Subgroups
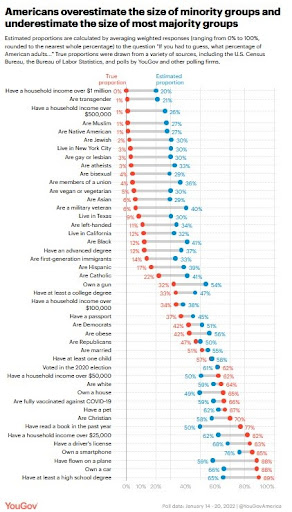
Image Courtesy of Legally Sociable
By Jeremy Perillo
While discussing politics in the United States, subgroups of the population, like racial and religious groups, tend to come into focus. The relevance of these subgroups often weighs on policy positions, candidate platforms, and partisan messaging. But how big are these subgroups in reality to the entire U.S. population? Polling conducted by YouGov reveals a trend that Americans tend to overestimate the size of these minority groups.
It is not surprising that these trends exist, given the attention politicians, political commentators, and echo chambers on social media foster attention to issues surrounding these subgroups, typically to rally political support or opposition. The stark differentiation between people’s average perceptions of group sizes and actual population estimates, reveals how Americans overestimate the size of minority groups and underestimate the size of majority groups.
For example, concerning religious minorities, Muslims were estimated to be 27% of the population, while in actuality they represent 1%. Similar trends were reflected towards Jewish Americans, with an estimate of 30% of the population, compared to the 2% they occupy. Sexual minorities were another group whose estimates were out of proportion to their true representation: Gays and lesbians, while estimated to be 30%, are only 3% of the population; bisexuals were estimated to be 29% of the population, but are reflective of 4%; and lastly, transgenders only make up 0.6% of the population, while respondents estimated they make up 21% of the population.
Other groups that were asked about were Catholics (estimated: 41%, true: 22%), individuals owning a gun (estimated: 54%, true: 32%), and those having a college degree (estimated: 47%, true: 33%). The survey got to a point where the respondents were estimating lower than the actual proportion, particularly when it came to majority groups, including groups that own a house (estimate: 49%, true: 65%), are Christian (estimate: 58%, true: 70%), and have a high school diploma (estimate 65%, true: 89%).
What does this all mean? As YouGov writes, inaccurate estimates of group sizes are not specific to instances of race, gender, sexuality, income, partisanship, etc. Respondents, and Americans as a whole, seemed unlikely to accurately estimate the size of lesser discussed groups, like Vegetarians or Vegans (estimate: 30%, true: 5%) and those who own a car (estimate 66%, true: 88%). YouGov contends that because of the lack of accuracy across the board, the errors in perception are not attributed to specific contexts surrounding certain groups.
It does put in perspective how political conversations can alter the perception of the subgroups. There is indeed a correlation between the estimate of certain groups – like transgenders, Muslims, and those with household income over $1 million – and obsessive coverage in public debate. Perhaps because of fixation by the media, the overall tendency to expand minority groups bigger than they are alters our perception of their true size. Considering there is a seemingly inherent tendency to misproportion groups in society, this begs the question: does the tendency of misunderstanding subgroups foster unnecessary animosity that deepens the political partisanship in this country?